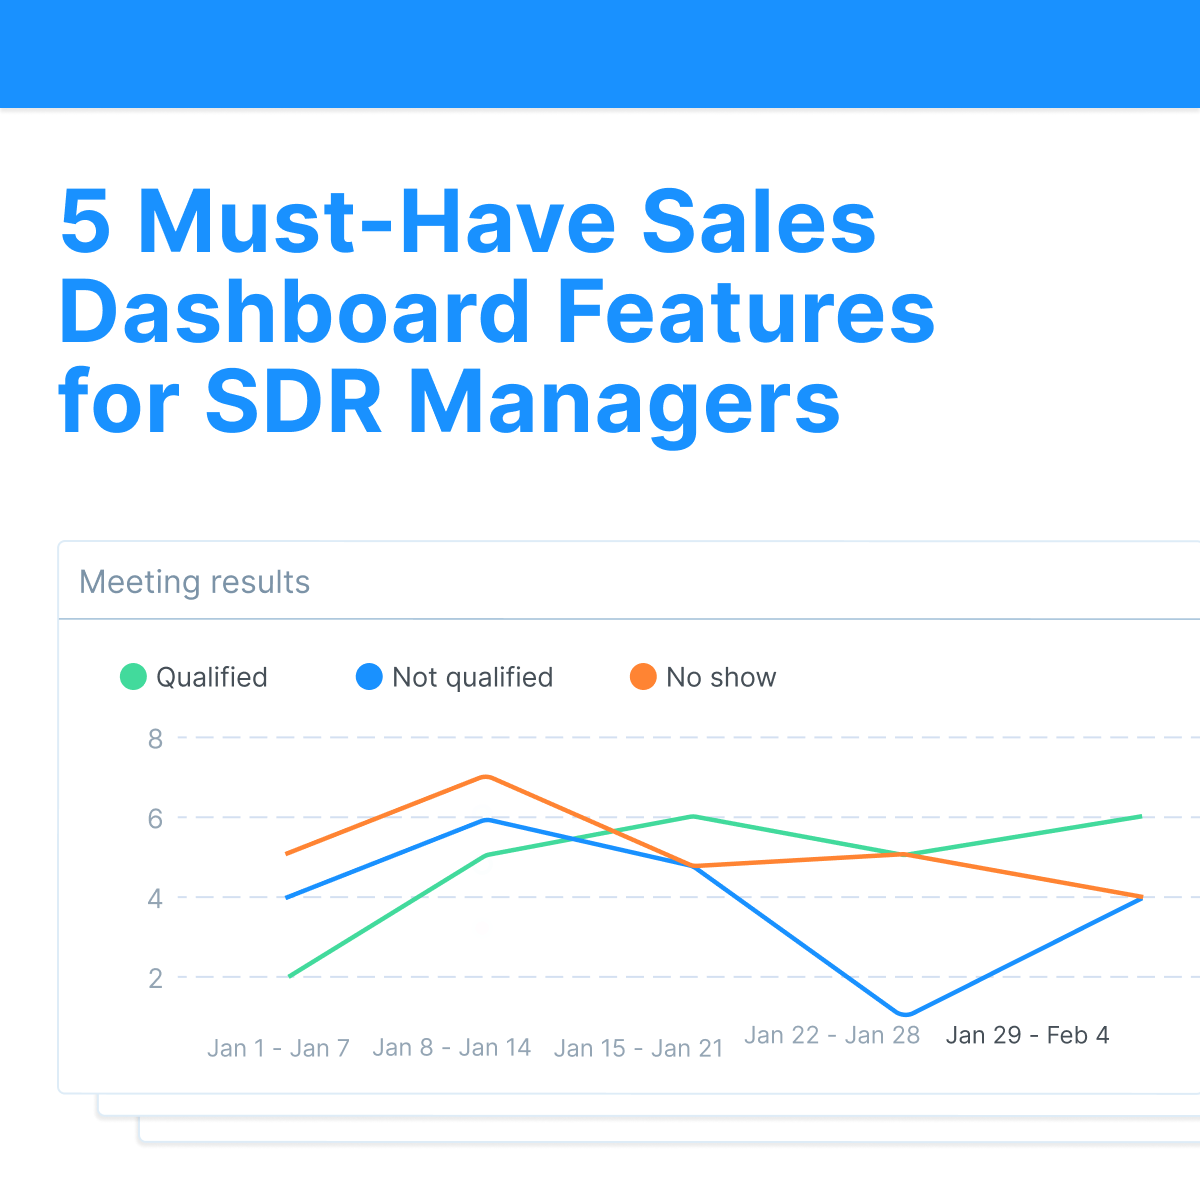
Top 5 Sales Dashboard Examples for Data-Savvy SDR Managers
See top sales dashboards examples that every sales development leader should be implementing now.
By Lucía Beldarrain on May 19, 2021
Every data-driven sales leader knows that team success and growth comes down to one major thing: your sales dashboard setup. Those top-notch sales and SDR managers can understand what’s working and what’s not in just 5-minutes of downtime before the next sales team meeting.
So, to find out the top sales dashboards that high-performing leaders should be paying attention to, we sat down with Bloobirds Product Manager Lennart Panknin to see Bloobirds Sales Empowerment Platform’s latest dashboards in action. He offered up his expert advice on how conversion rate and sales team performance dashboards can help you truly understand and improve your sales pipeline.
You can watch the full webinar on-demand or read on to check out the top five sales dashboards every sales and SDR manager needs👇
Must-Haves in Your Prospecting and Sales KPI Dashboards:
1. The Prospect Contact Rate Dashboard: Outreach to Conversation Conversion
Within the context of outbound sales and prospecting, the contact rate is the percentage of leads that your reps have tried to contact versus dialogues actually achieved.
In other words, out of all the people in your contact list, how many were your SDRs able to have a conversation with?
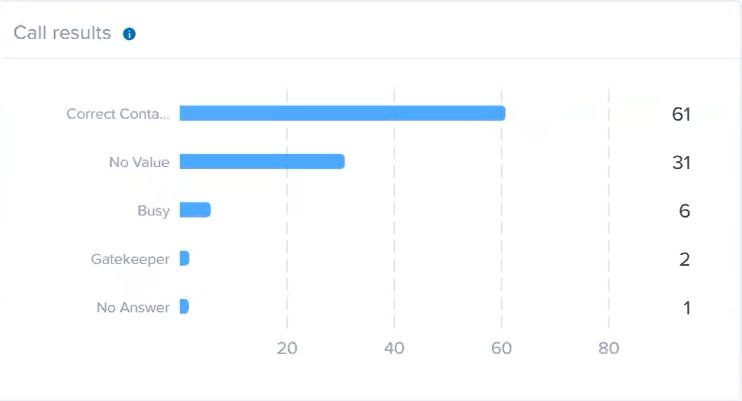
Lennart Panknin, former Bloobirds SDR and current Product Manager comments, “First, let’s look at the results of your call attempts.
This is also something that is great to measure if you’re trying to contact prospects in order to understand:
What are the results of our calls?
Are we usually stuck with Gatekeepers?
Are we not getting any answers?
Or are we talking with the correct person or buyer persona?
Here in this sales dashboard example above, you see the main number of calls with the correct contact, with the correct person. So, if you are tracking the contact rate, then you can also optimize it.
And that’s the underlying theme of Bloobirds sales dashboards and our overall philosophy. If you can optimize, if you can track it, then you can improve it.”
2. The Messaging Relevance Dashboard: Contact to Meeting Conversion
Messaging relevance is the conversion rate from the initial conversation with a prospect via phone, email, or LinkedIn, to a booked meeting.
Lennart elaborates, “Here at Bloobirds, one of our best sales dashboards for SDR managers is the conversion rate of companies from contacted to meeting. So, before we were talking about contactability – how many companies are we able to have a conversation with? Then in this dashboard below, we’re looking at our relevance. So, with all the companies that we’re able to have a conversation with, with how many of those are we getting a meeting? This measures how relevant our messaging and value proposition is to prospects.
And since we are tracking messaging relevance, you’re also able to analyze your outbound efforts and understand where there are potential problems and what can be improved.”
“The messaging relevance dashboard measures how relevant your value proposition is to prospects, allowing you to optimize your pitch.”
3. Increase SDR Effectiveness with Conversion Rates by Target Market and Buyer Persona Dashboards
SDRs become more effective when they’re consistently targeting prospects who are the most likely to buy your solution. While most companies already have a solid idea of their ideal customer, this sales KPI dashboard takes it a step further –
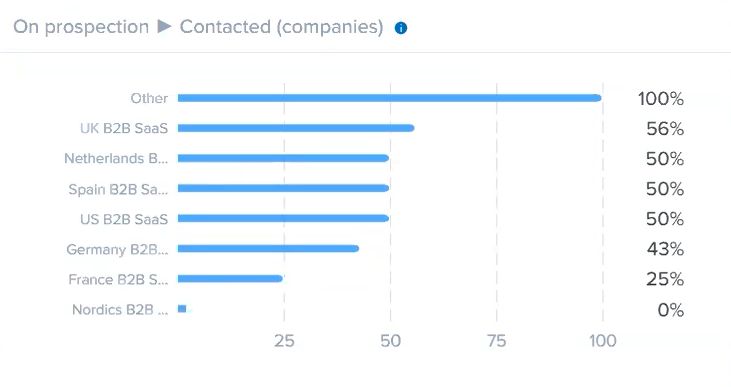
Lennart explains, “Let’s start by comparing conversion rates across Target Markets. You can see, for example below: In the UK, the contactability of being able to have the first conversation with a prospect is quite high. While in France, we’re not able to even get a conversation. So, maybe, there’s something to analyze and understand the why behind it.
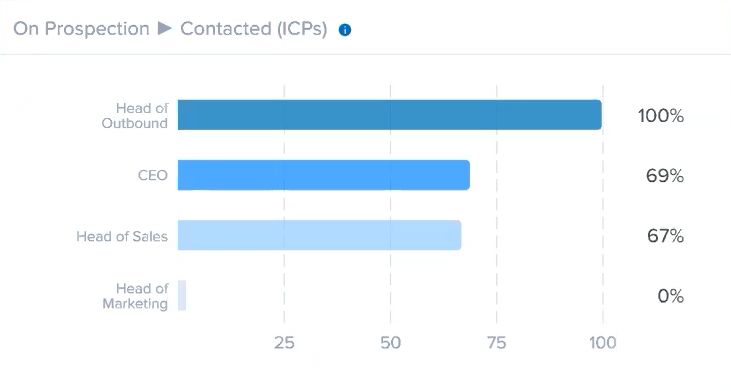
Then, we are also looking at ICP (Ideal Customer Profile) or buyer persona, which is something that we are tracking always at Bloobirds. We’re checking with which people, with who do we want to get in contact with? And of all those people we want to contact, we assign a buyer persona to them. Then we can analyze with which personas we can get in touch with or not because that’s a huge thing when it comes to SDR or sales rep performance.
You can drill down and ask: Should I contact the company’s CEO, or does it make more sense to contact the Head of Sales of the company? These things, even though they seem small, can really be game-changers.
And sometimes, it really helps to go one level lower in the hierarchy. Suddenly, you have a way better contactability with a mid-level manager buyer persona. And then, from that person onwards, you get to the CEO, for example.
This is built-in to Bloobirds, and tracking that also helps you to understand what is working what is not working and improve rep effectiveness.
4. Replicate Sales Rep Best Practices With Performance Dashboards
The key to every successful sales team is scaling best practices. But to repeat your best sales rep or SDR’s tactics throughout the team, you’ll need to be able to understand exactly how they achieve success.
These dashboards identify individual trends in order to replicate what the highest-performing SDR is doing.
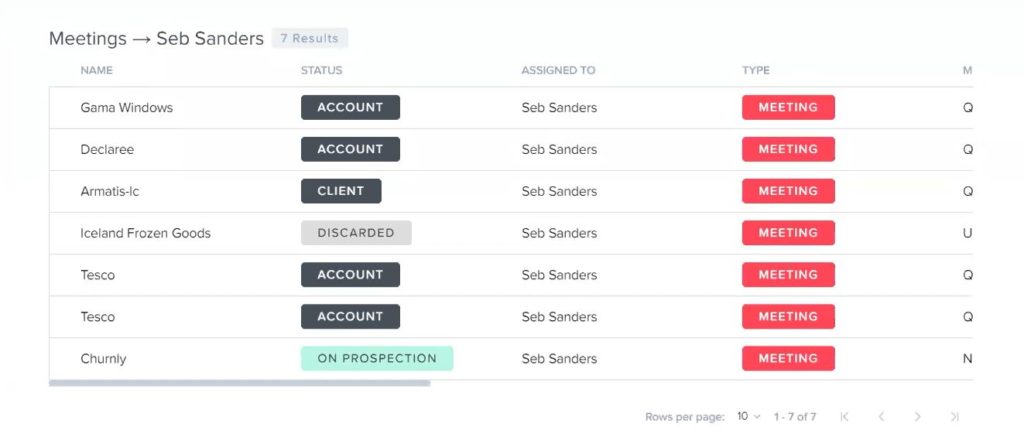
Lennart explains, “Another interesting sales dashboard tip is to compare sales reps and see their performance. So here in our example, we have a sales rep, an SDR called Seb, and he got seven meetings. Our best SDR in this example.
Inside Bloobirds dashboards, we can say, okay, show me those meetings. With which companies did he get meetings?
And, essentially what we try to do is we try to understand why is this SDR is performing so well and how other SDRs can do the same so that they profit from that. We identify trends to replicate in a sense what the highest-performing SDR is doing. In turn, other SDRs or sales reps can do the same, helping them to get more meetings themselves.”
5. Optimize Your Prospecting Process with Sales Pipeline Dashboards
A solid sales prospecting pipeline depends on two major things: the quality of the prospects going in and how quickly and efficiently they’re turning into opportunities. And the best sales dashboards should help you quickly analyze both aspects.
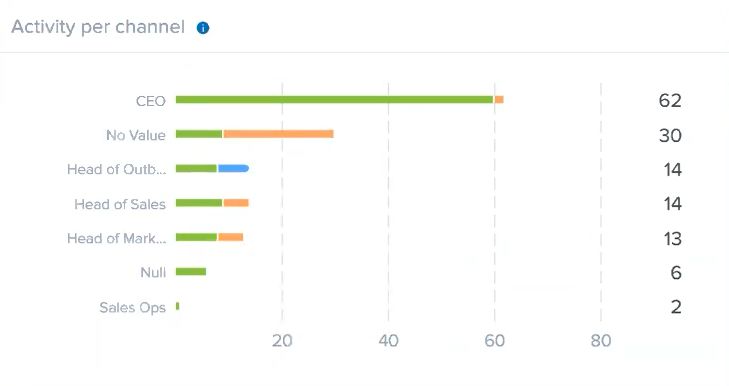
Lennart offers a three-step process, “Ok, so first off, inside this chart we can see – On which buyer persona are we spending our activity? On which target market are we spending our activity? What’s the source of companies that we’re spending most of our activity on? I think that’s very important.
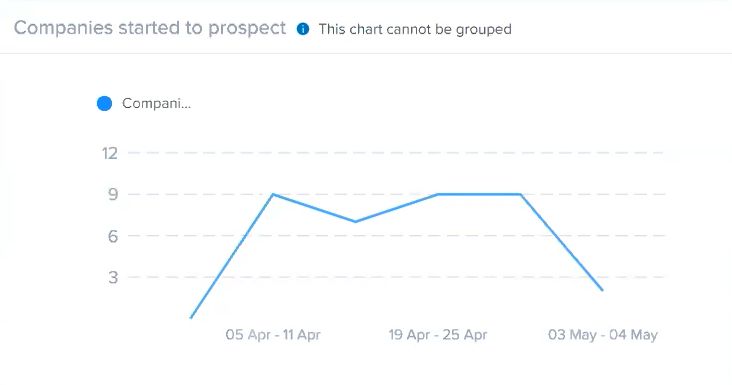
Second, I would encourage you to look into this chart: the companies you’ve started to prospect. Make sure you have a steady rhythm. You should always start to prospect a similar number of companies per week, a similar number of companies per month. Then group it by, for example, sales rep and making sure all the sales reps are starting to prospect a similar number of companies.
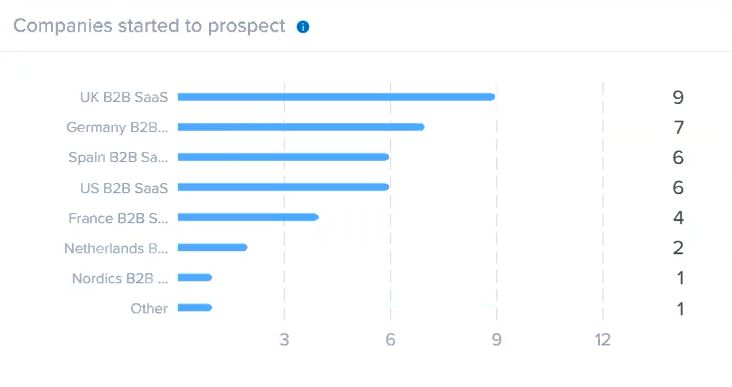
Lastly, we’ll also need to make sure that you’re focusing on the right target markets. This other chart, Companies started to prospect really allows you to say, ‘OK, this week, this month, we start to prospect a lot of companies in the UK, and maybe that’s actually not what we want to. This is something you see here.’
The activity tells you how much, how active, and how much effort we invest in these companies. Drill down into all of this and try to understand how your sales prospecting pipeline is running.“
Turn Top Sales Dashboard Examples Into Reality
Now you’ve seen examples and ideas of the best sales dashboards, but building them out on your own is a daunting task. Bloobirds offers in-depth prospecting and sales dashboards right out of the box. Get started with our sales empowerment platform, and you can start making better decisions for your team in a matter of days.